Task
Concept and implementation
Client
ESM
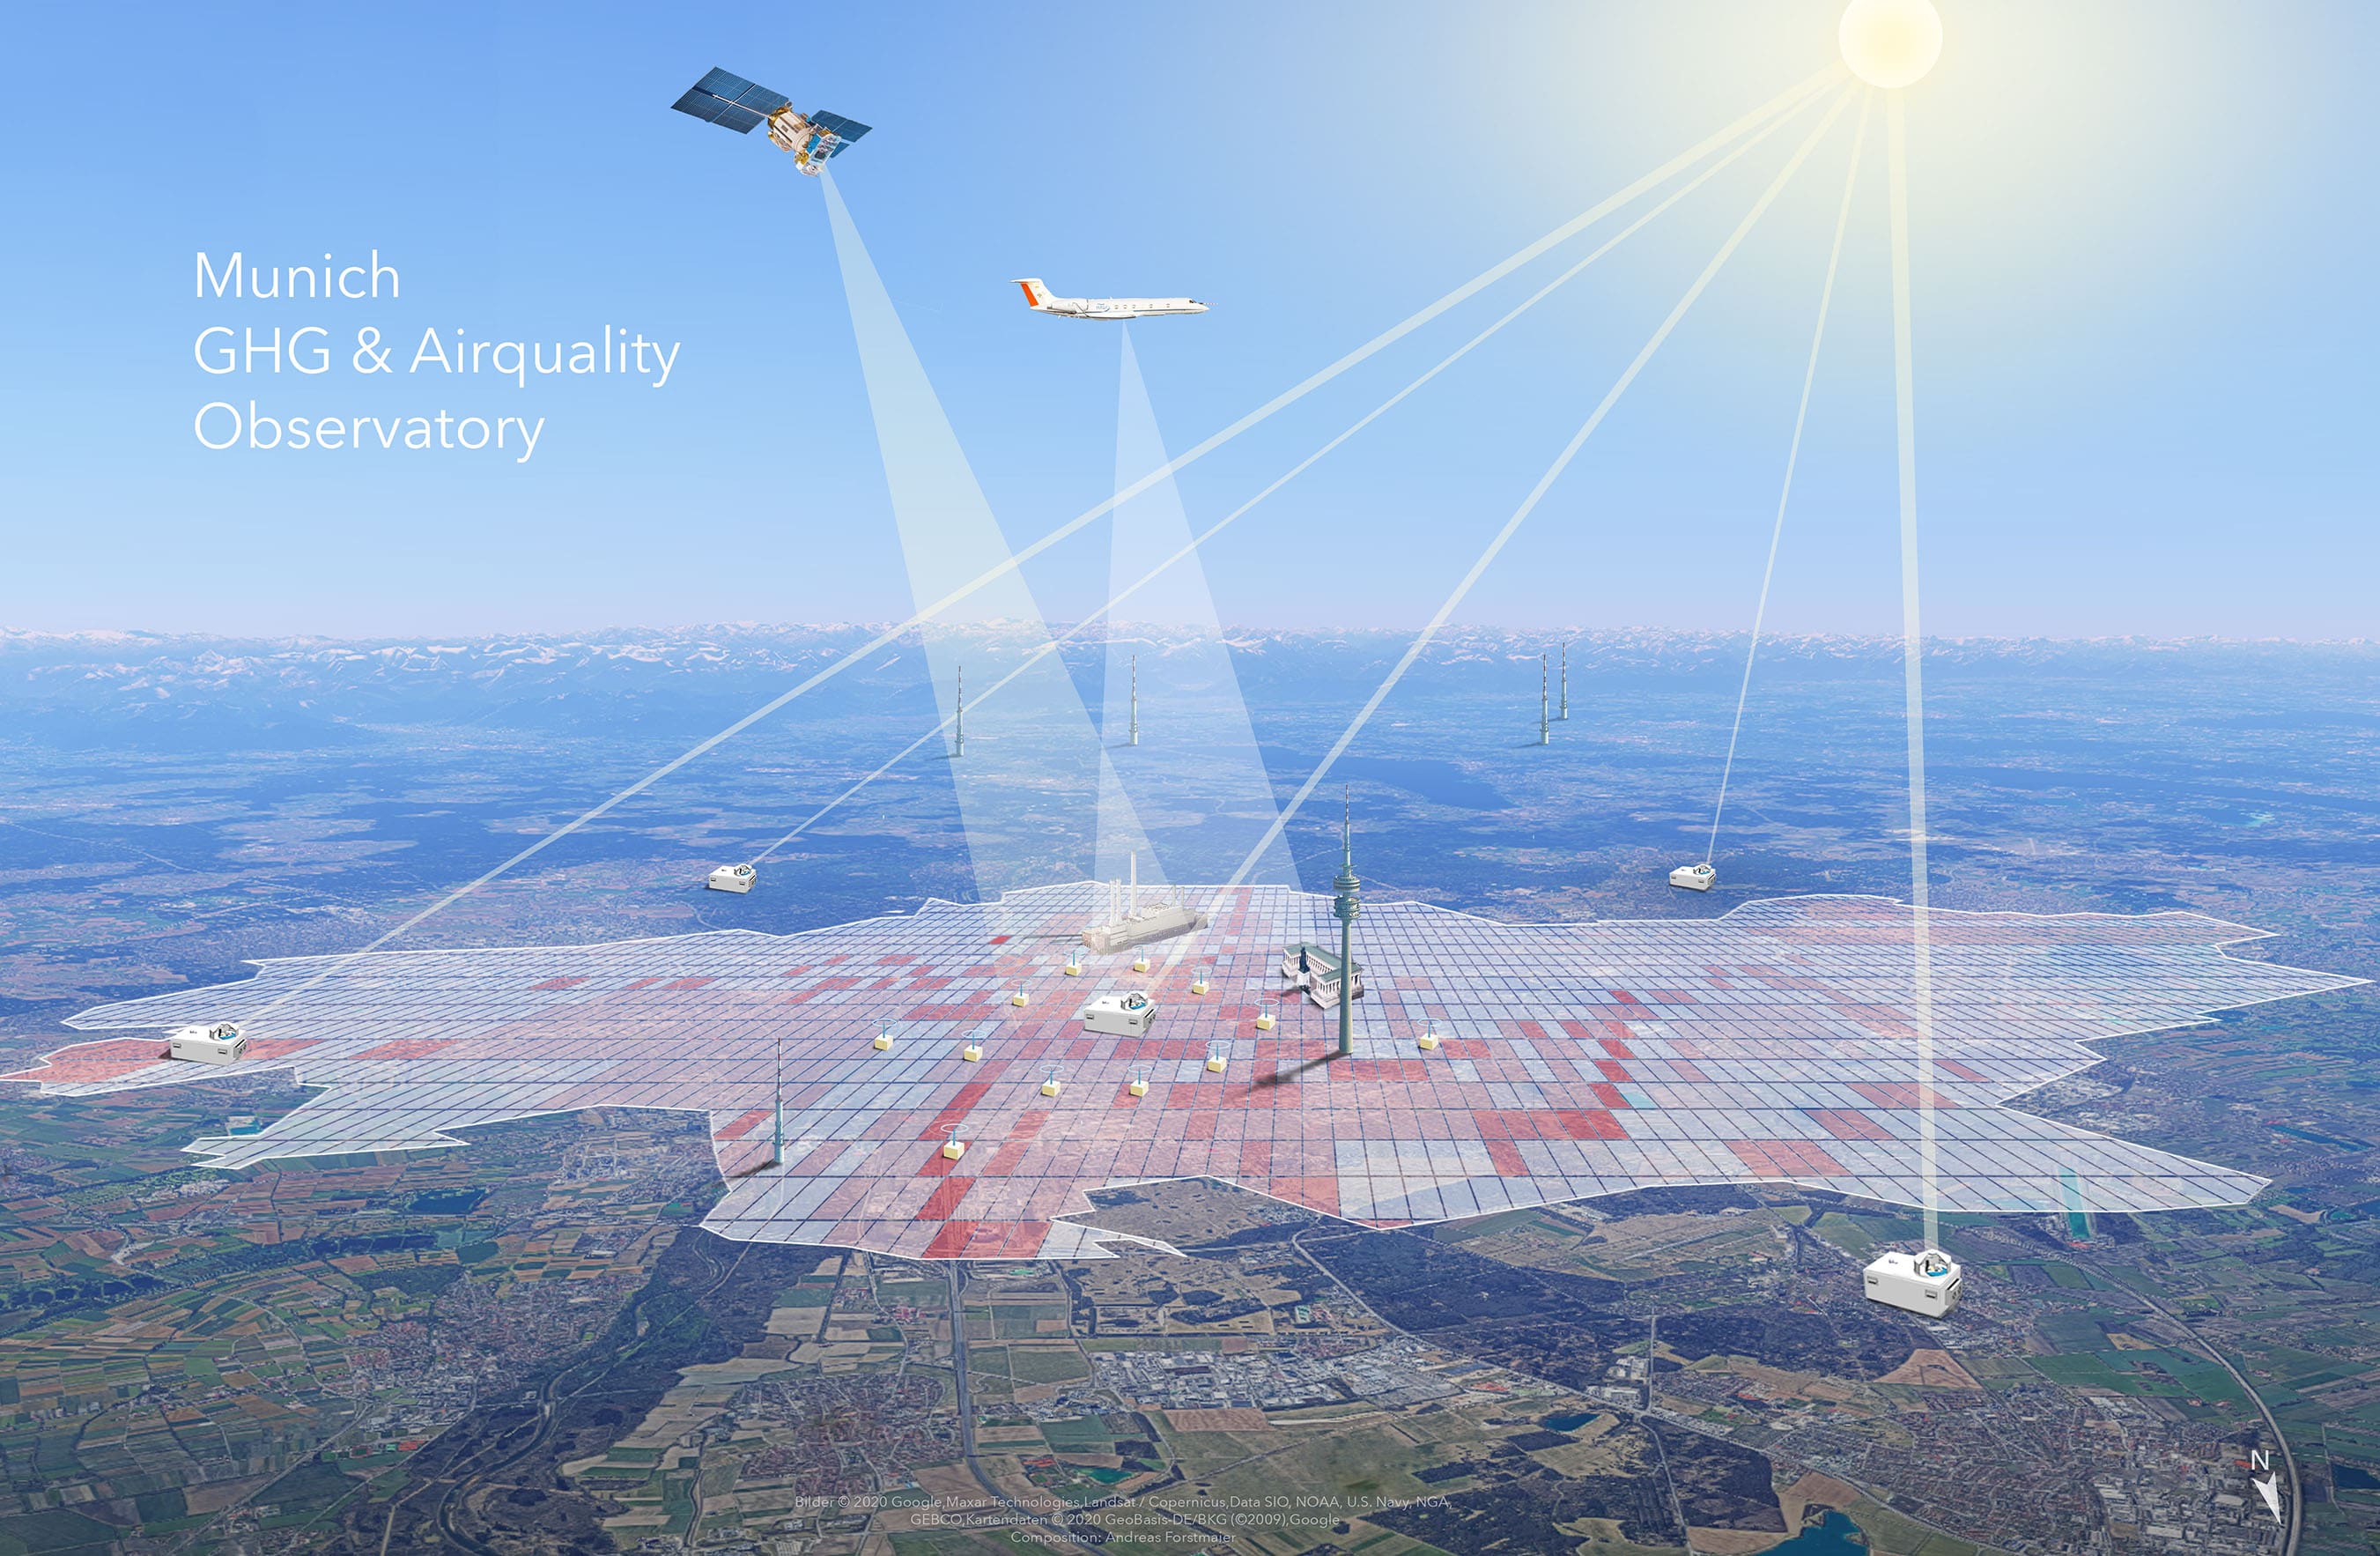
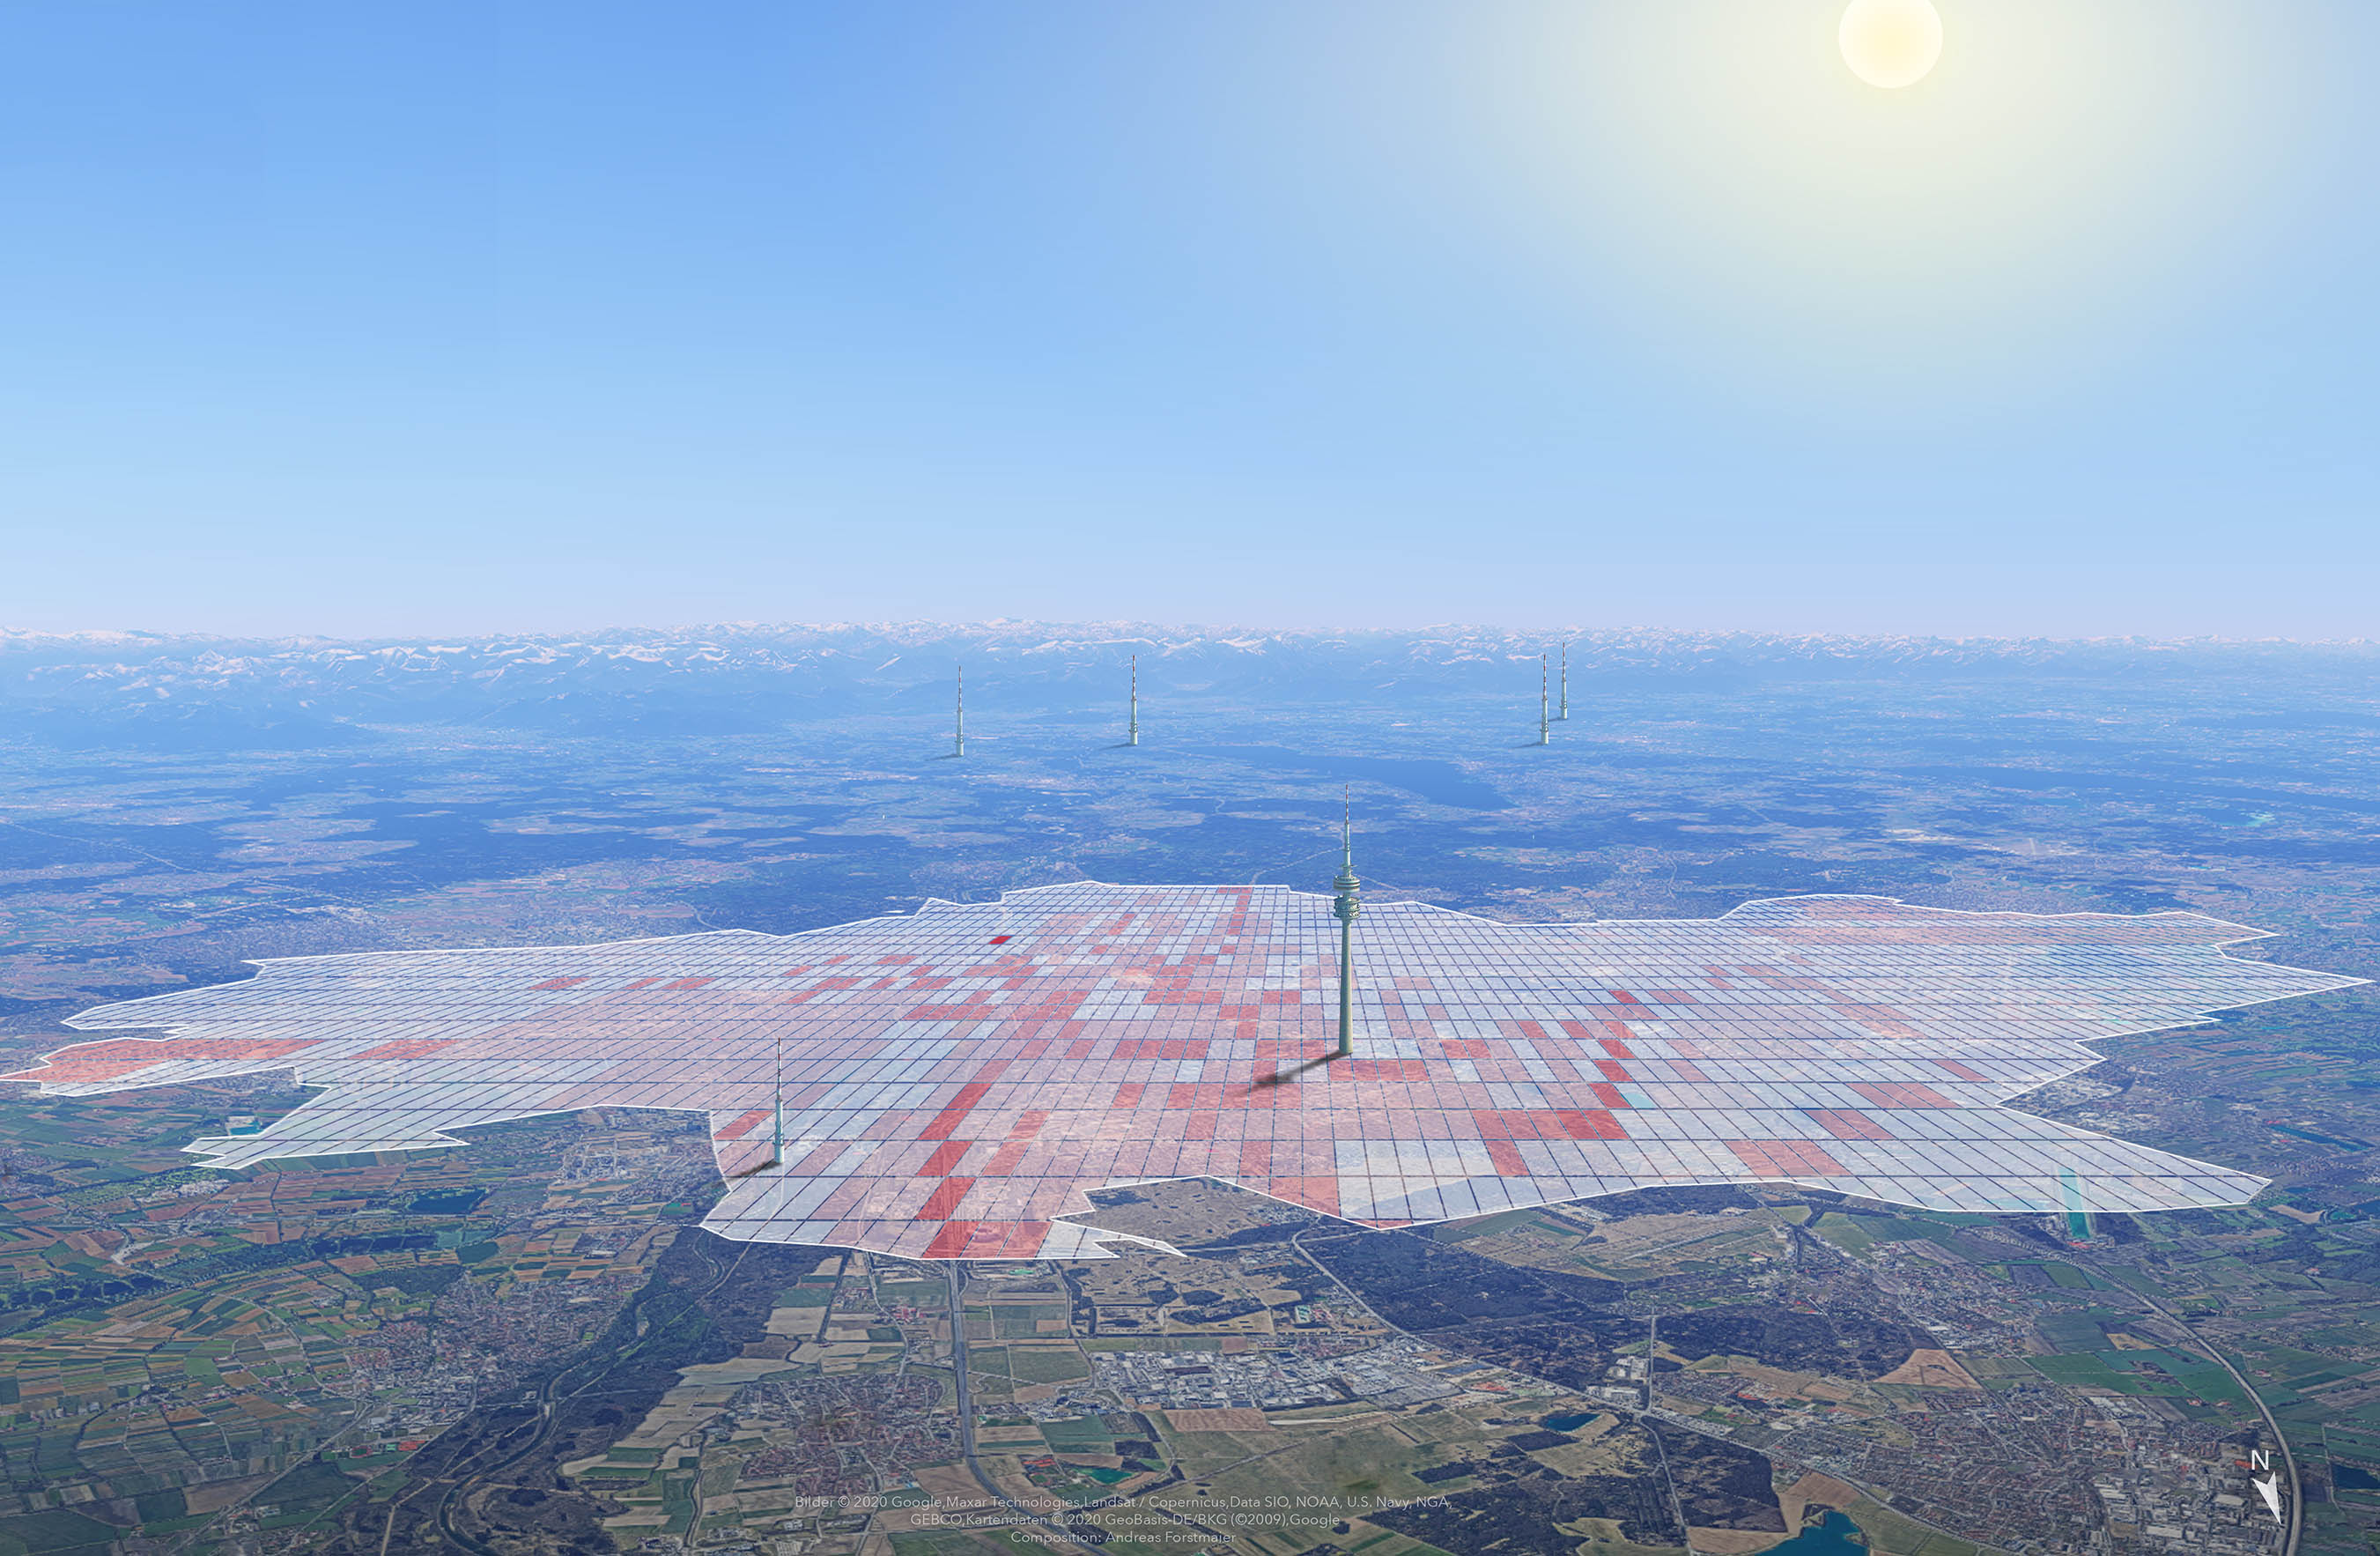
For a research project, a clear visualisation of the measuring devices and superstructures was realised. The visualisation, based on a three-dimensional map, shows the relevant substructures that represent the fundamental components of the project.
Five spectrometers that use the sun as a light source form the core of the setup. The observatory is supported by several smaller air quality sensors distributed throughout the city.
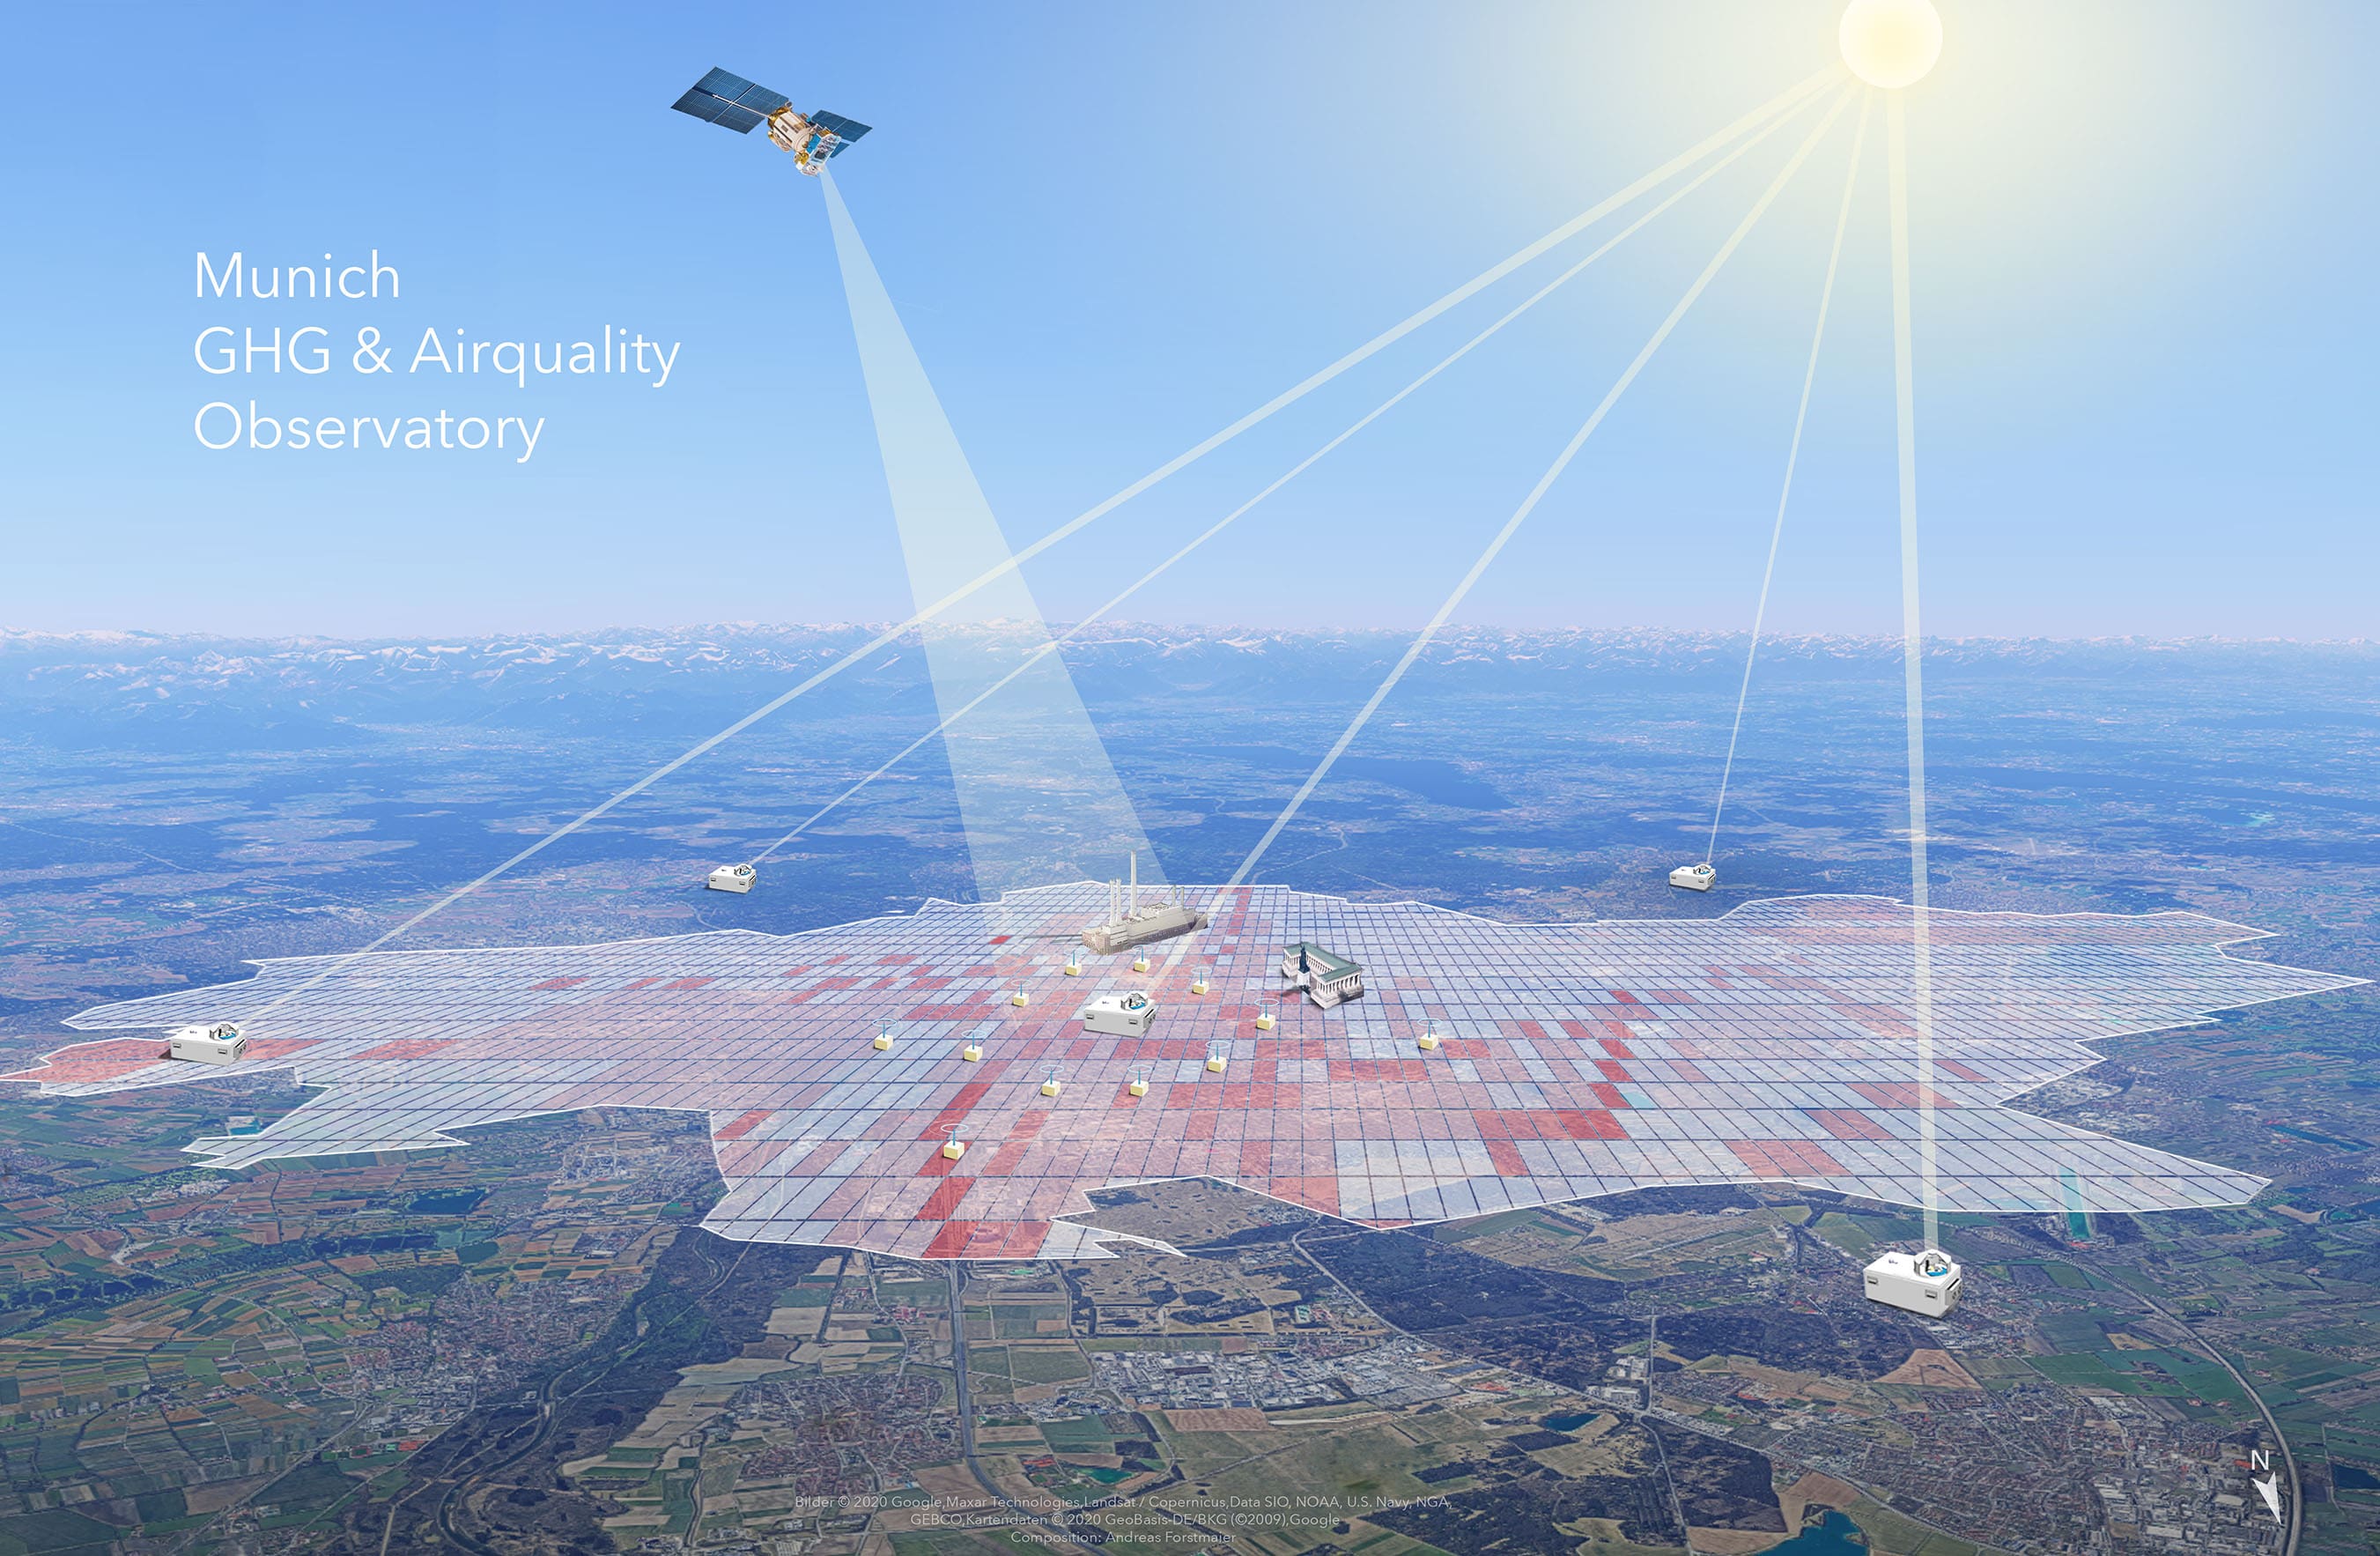
For a future extension of the measurement set-up, further possibilities for locations of the measurement set-ups were visualised.
Several towers and profile measurements on aircraft were also taken into account.