Task
Concept and design
Client
ESM
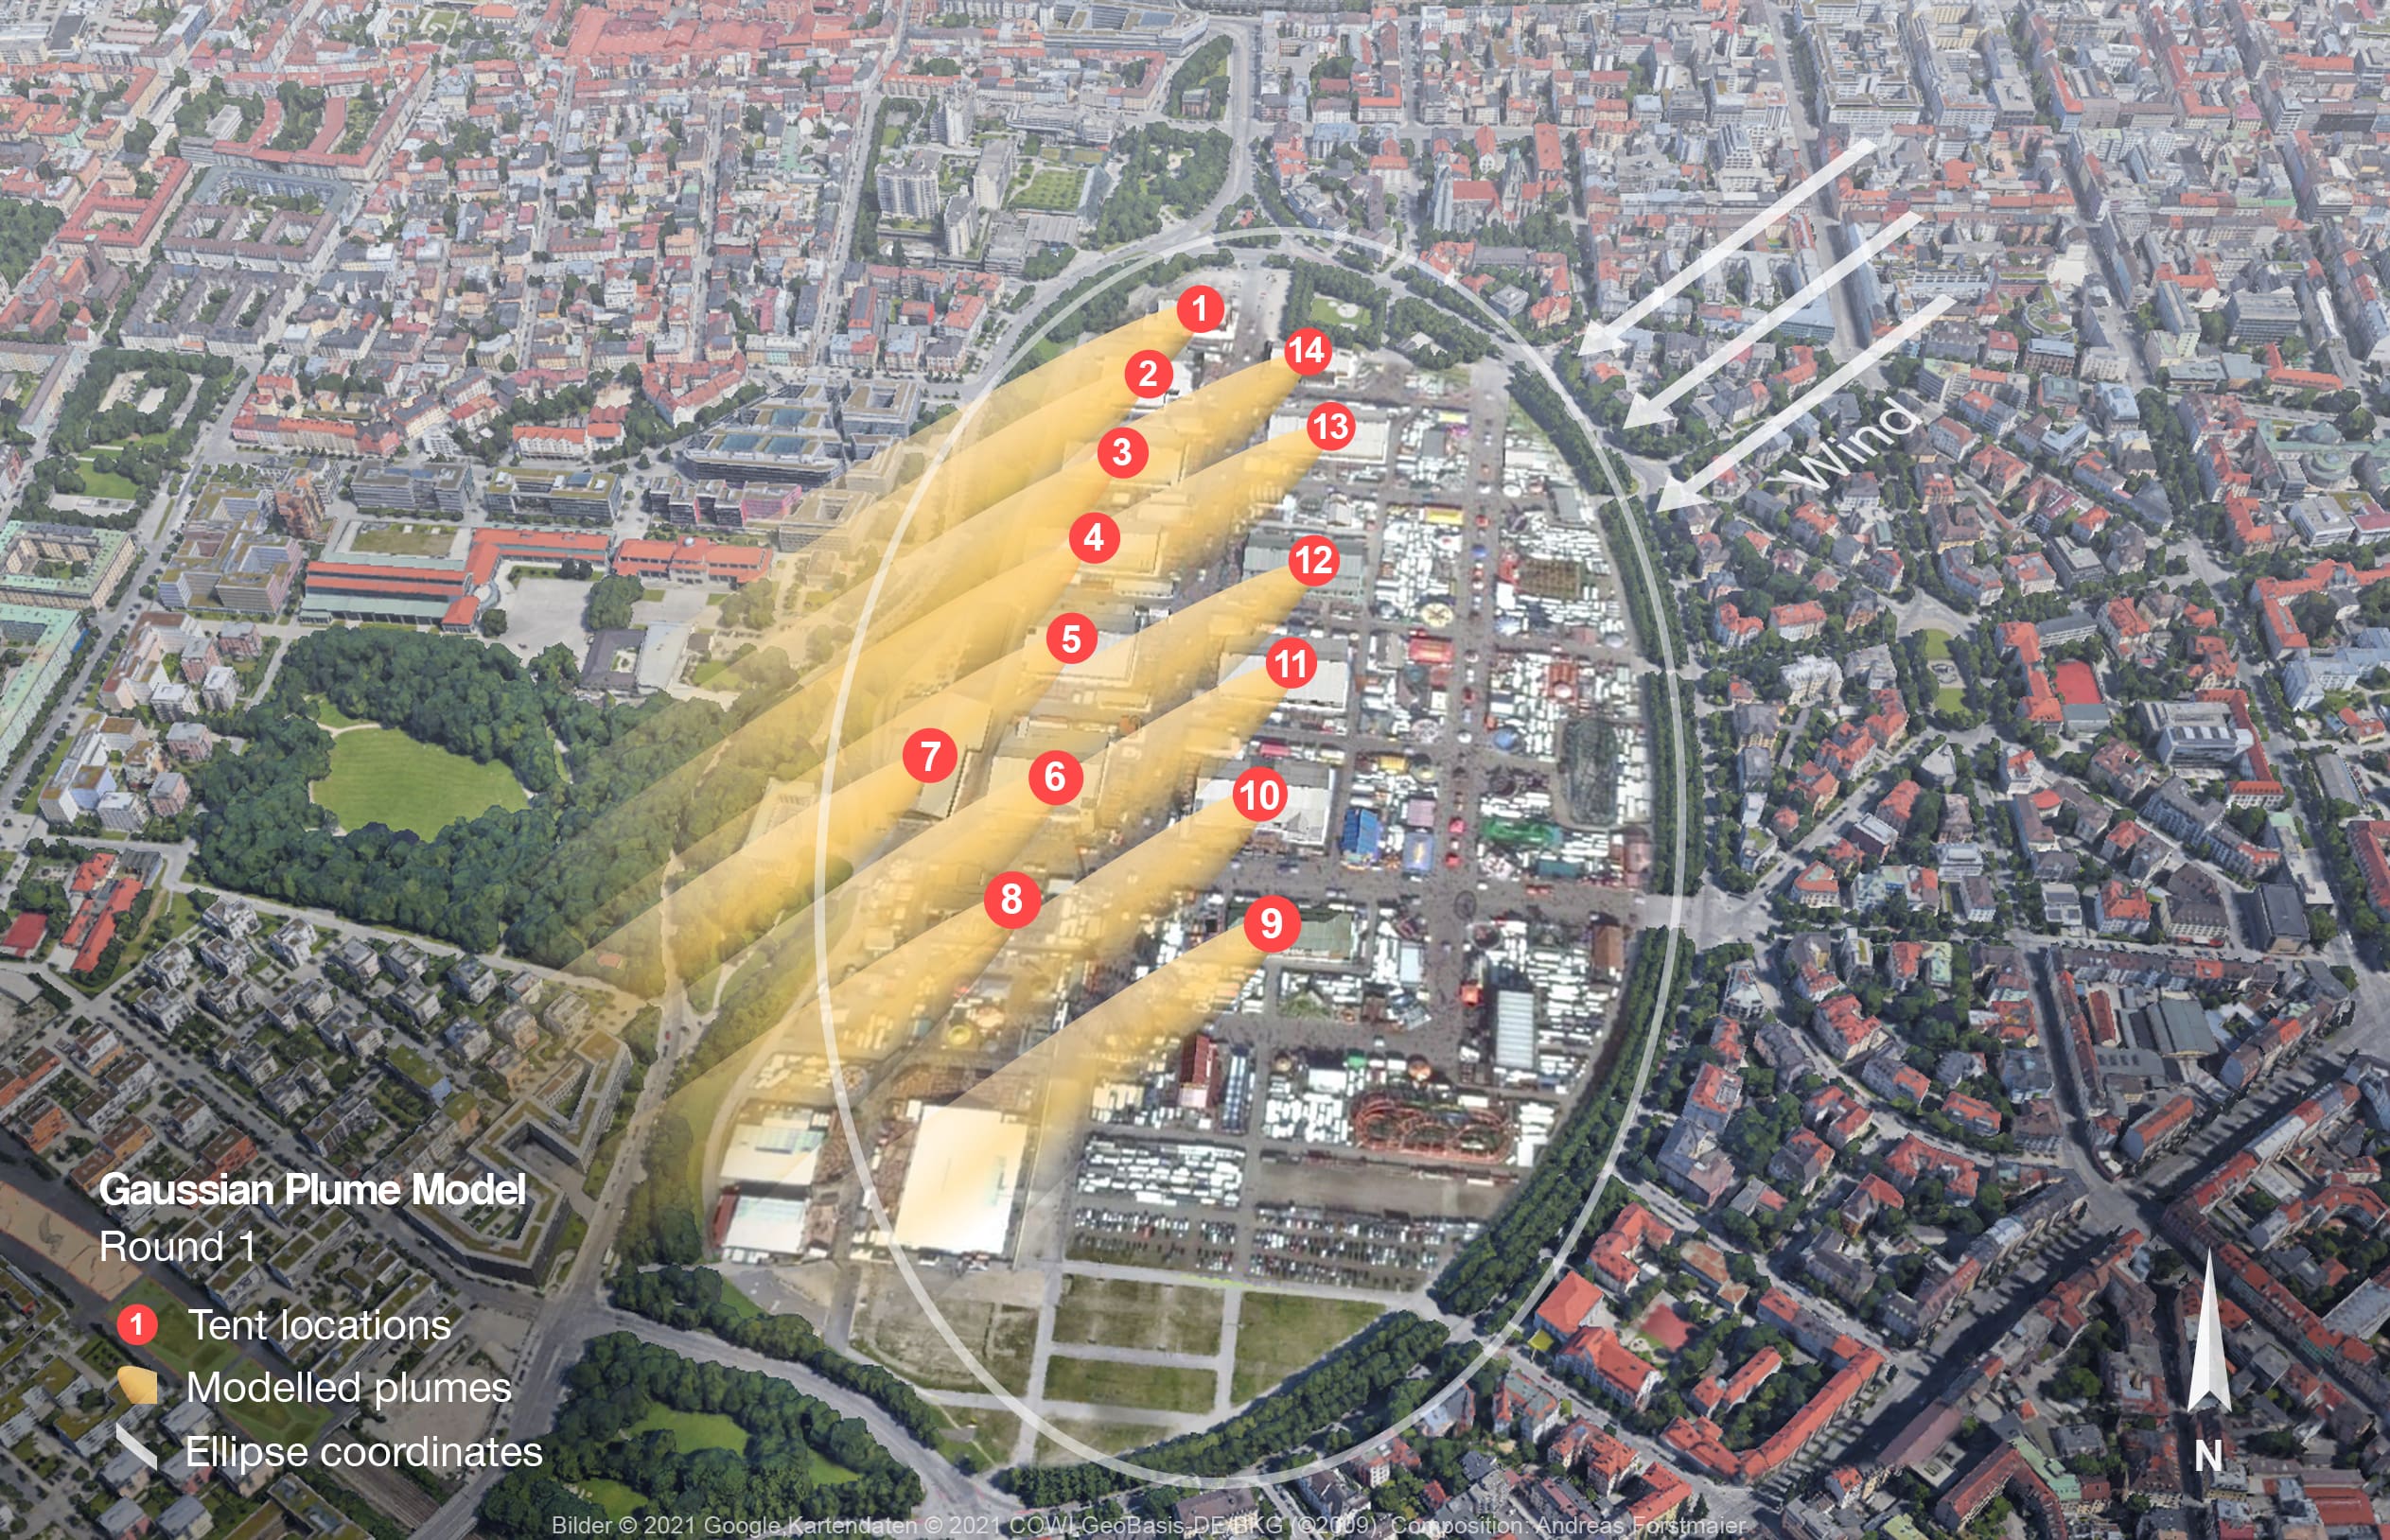
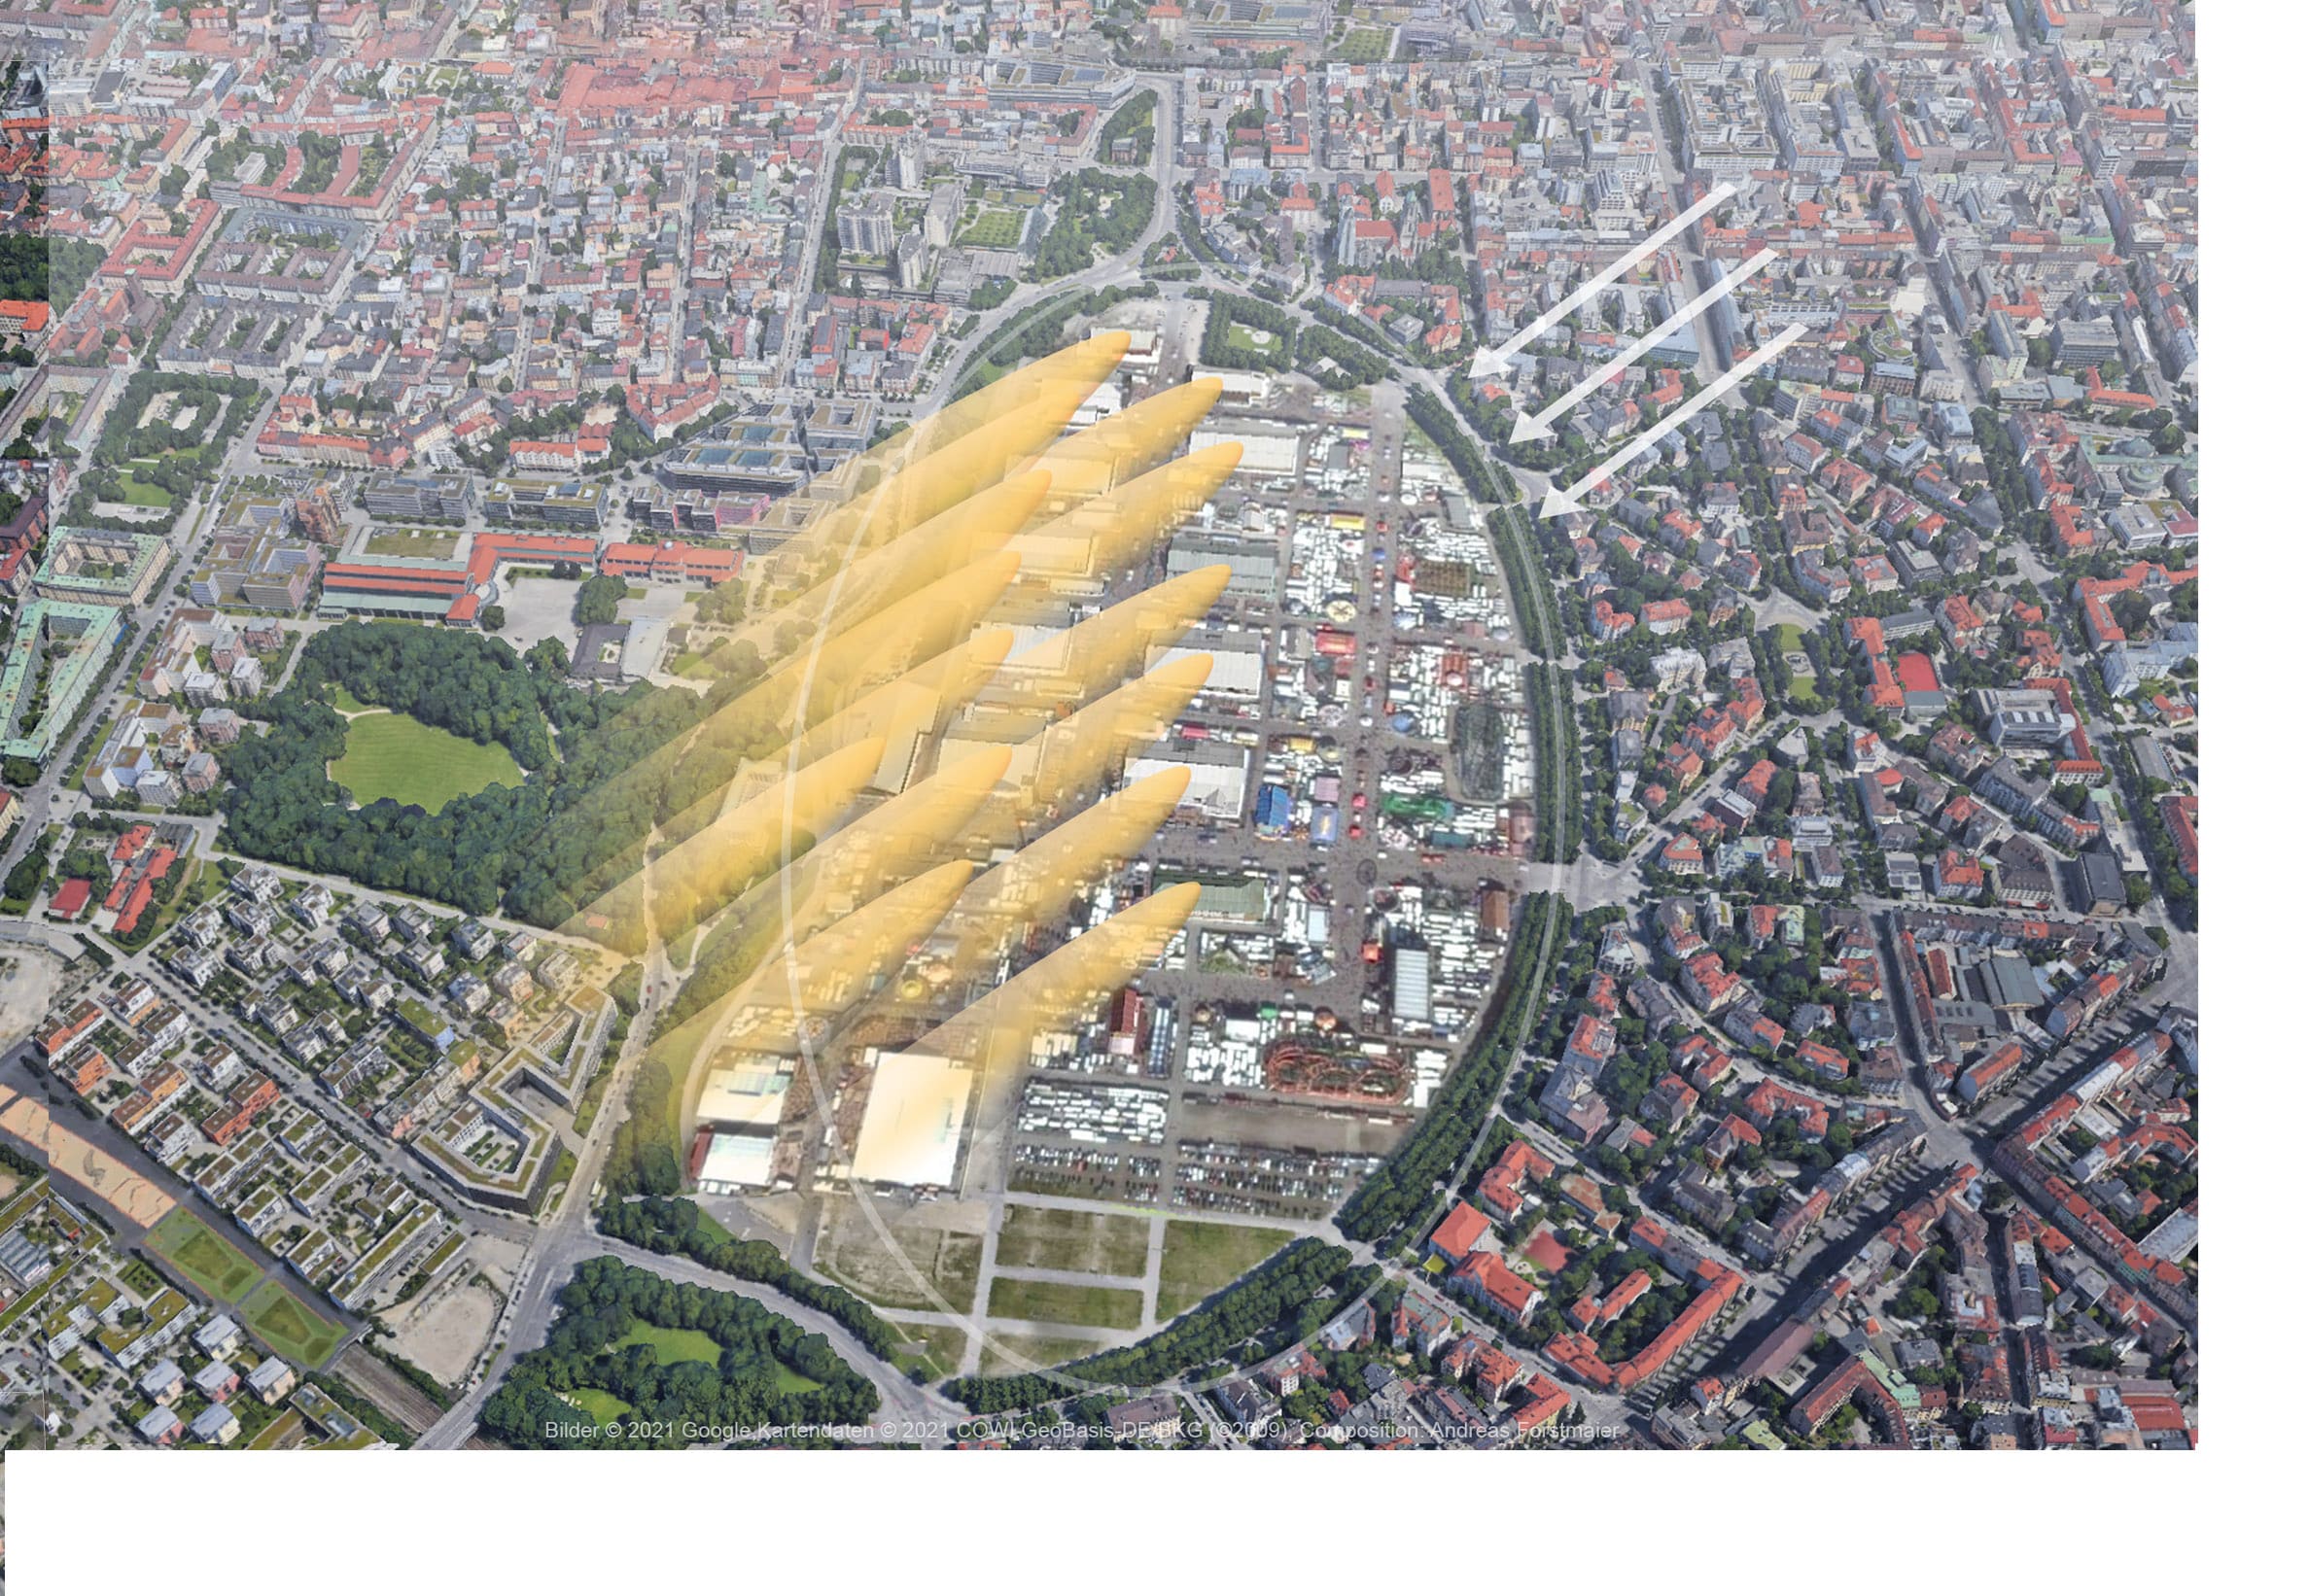
During a measurement campaign in Munich, the greenhouse gas emissions of the Oktoberfest were determined. The 14 larger tents were assumed to be the main sources of the gases.
The exhaust air from the tents was modelled and visualised on a map for clear presentation.
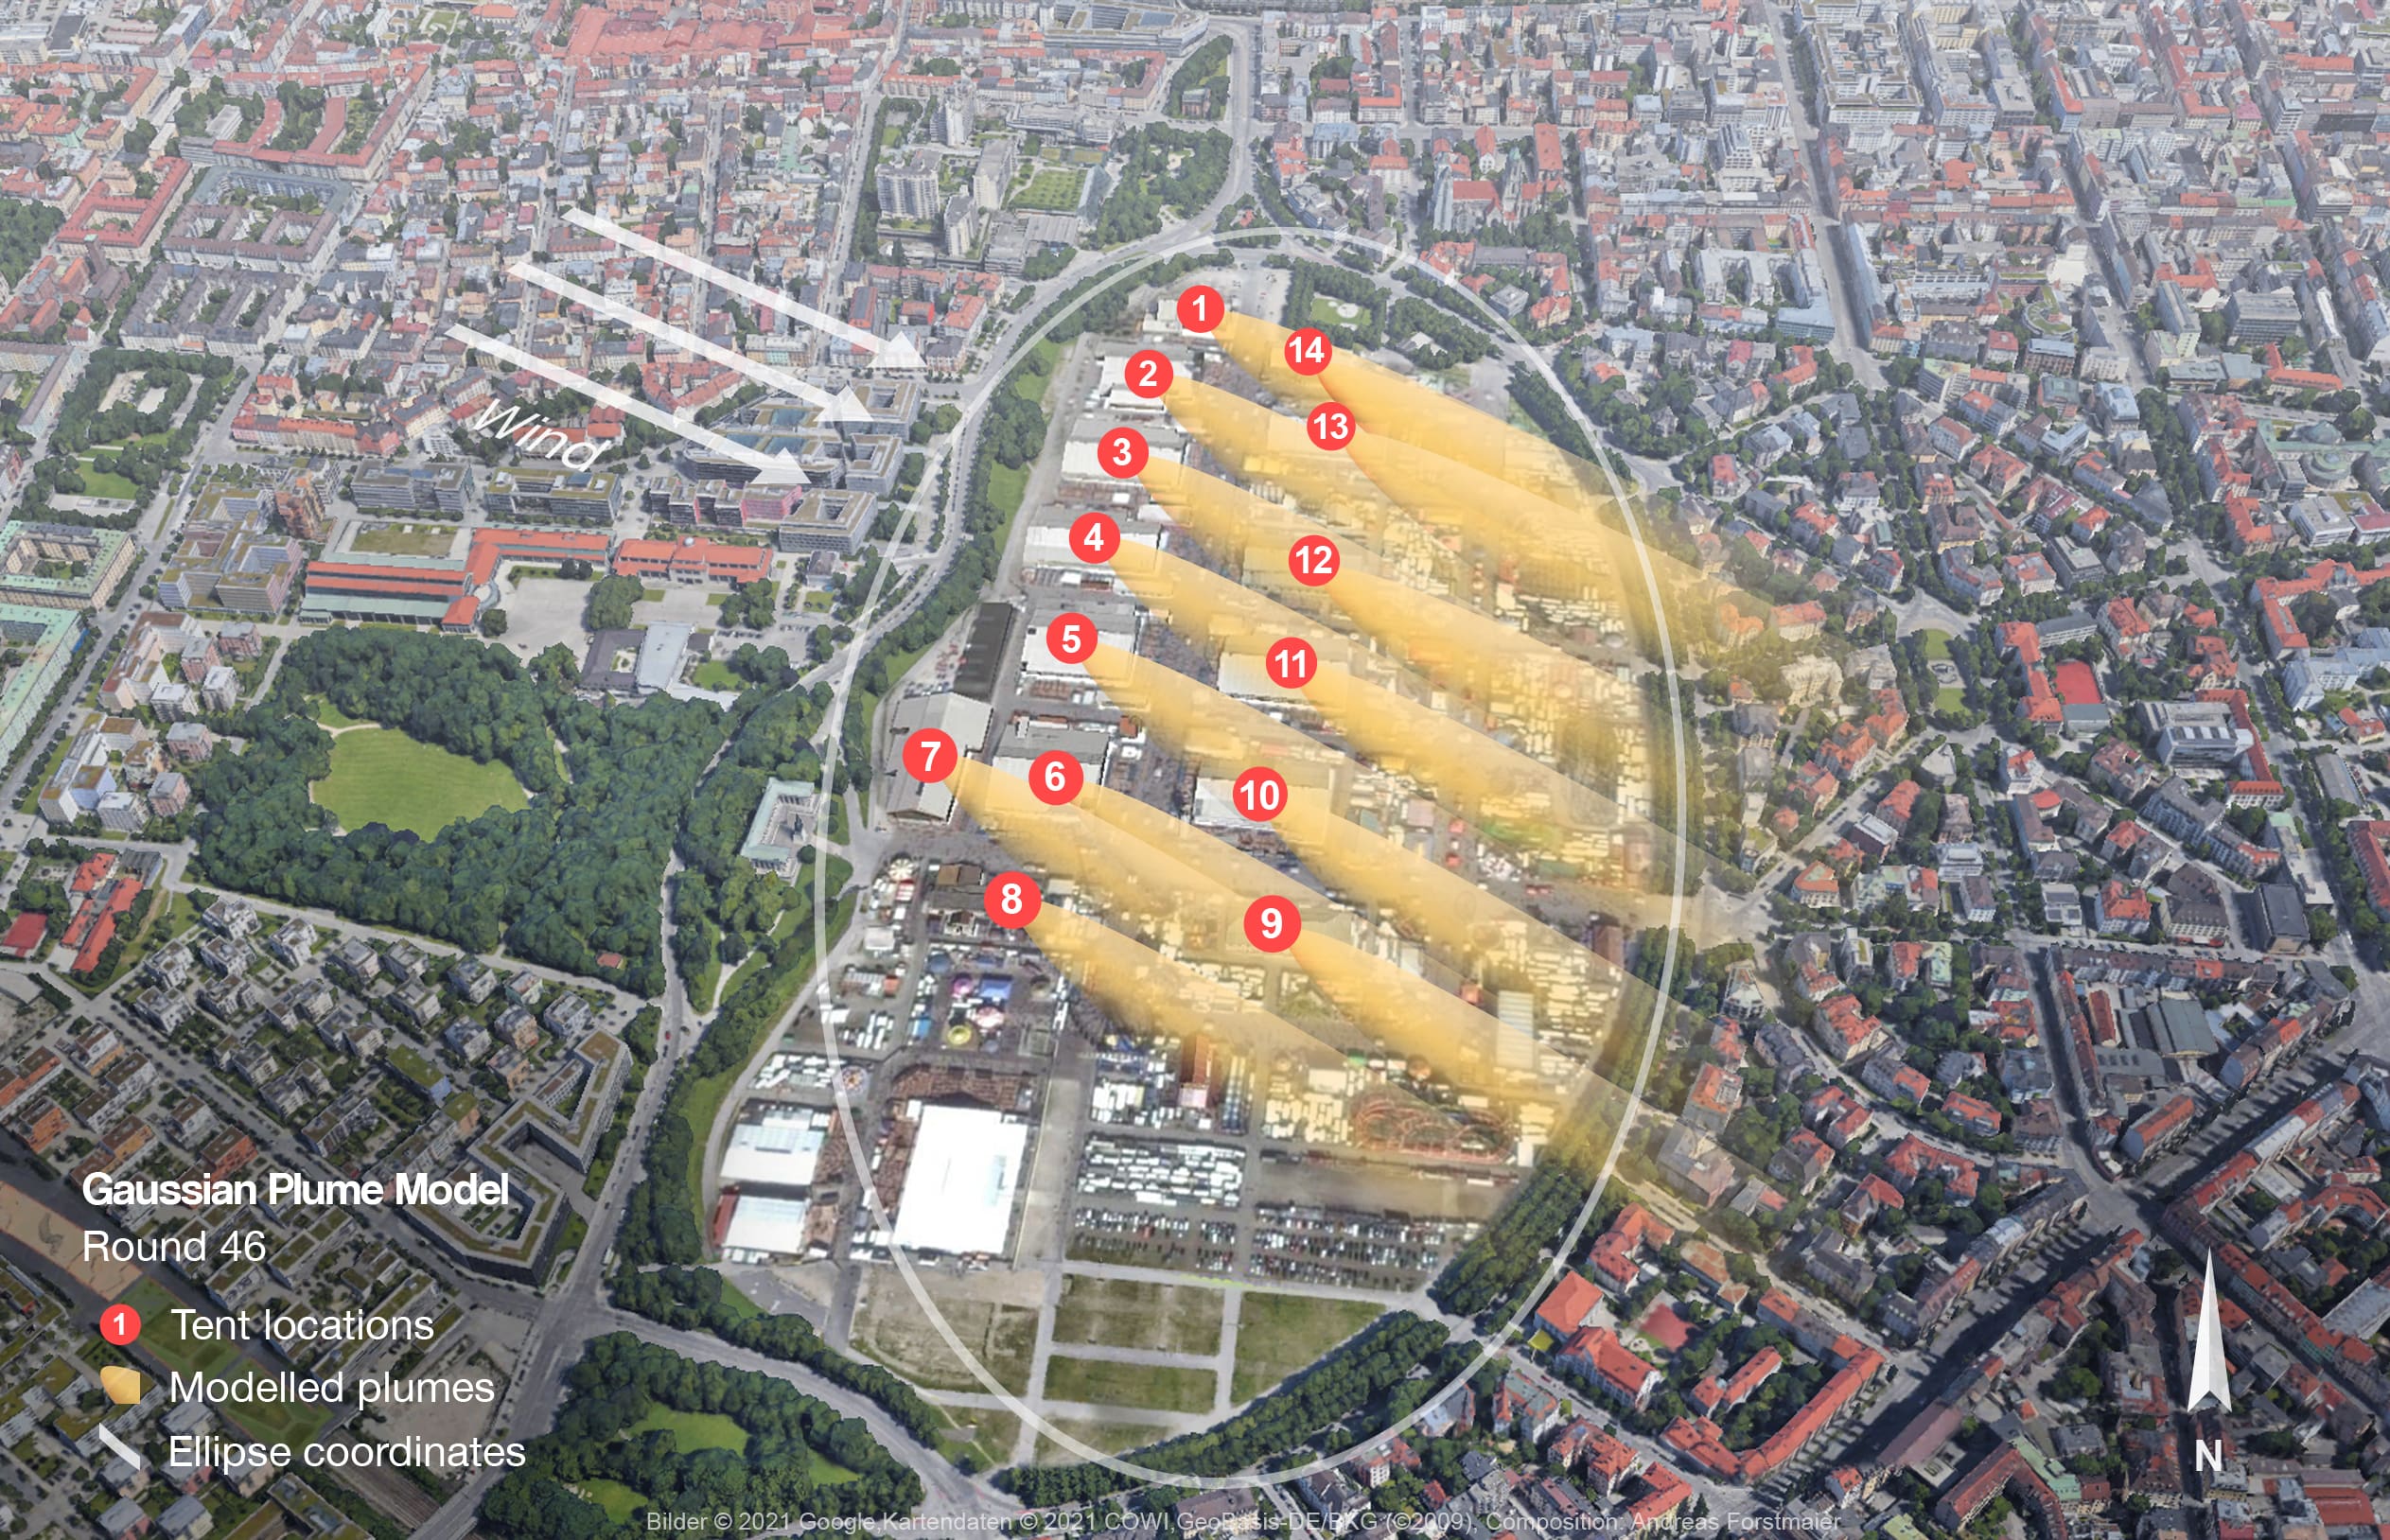
To investigate the behaviour in different wind directions, visualisations for different wind directions were also created. The composition is made up of different 3D and 2D map material, which was seamlessly combined with each other.
If you are interested in the study conducted, further information is linked below.